SAE form signature summary
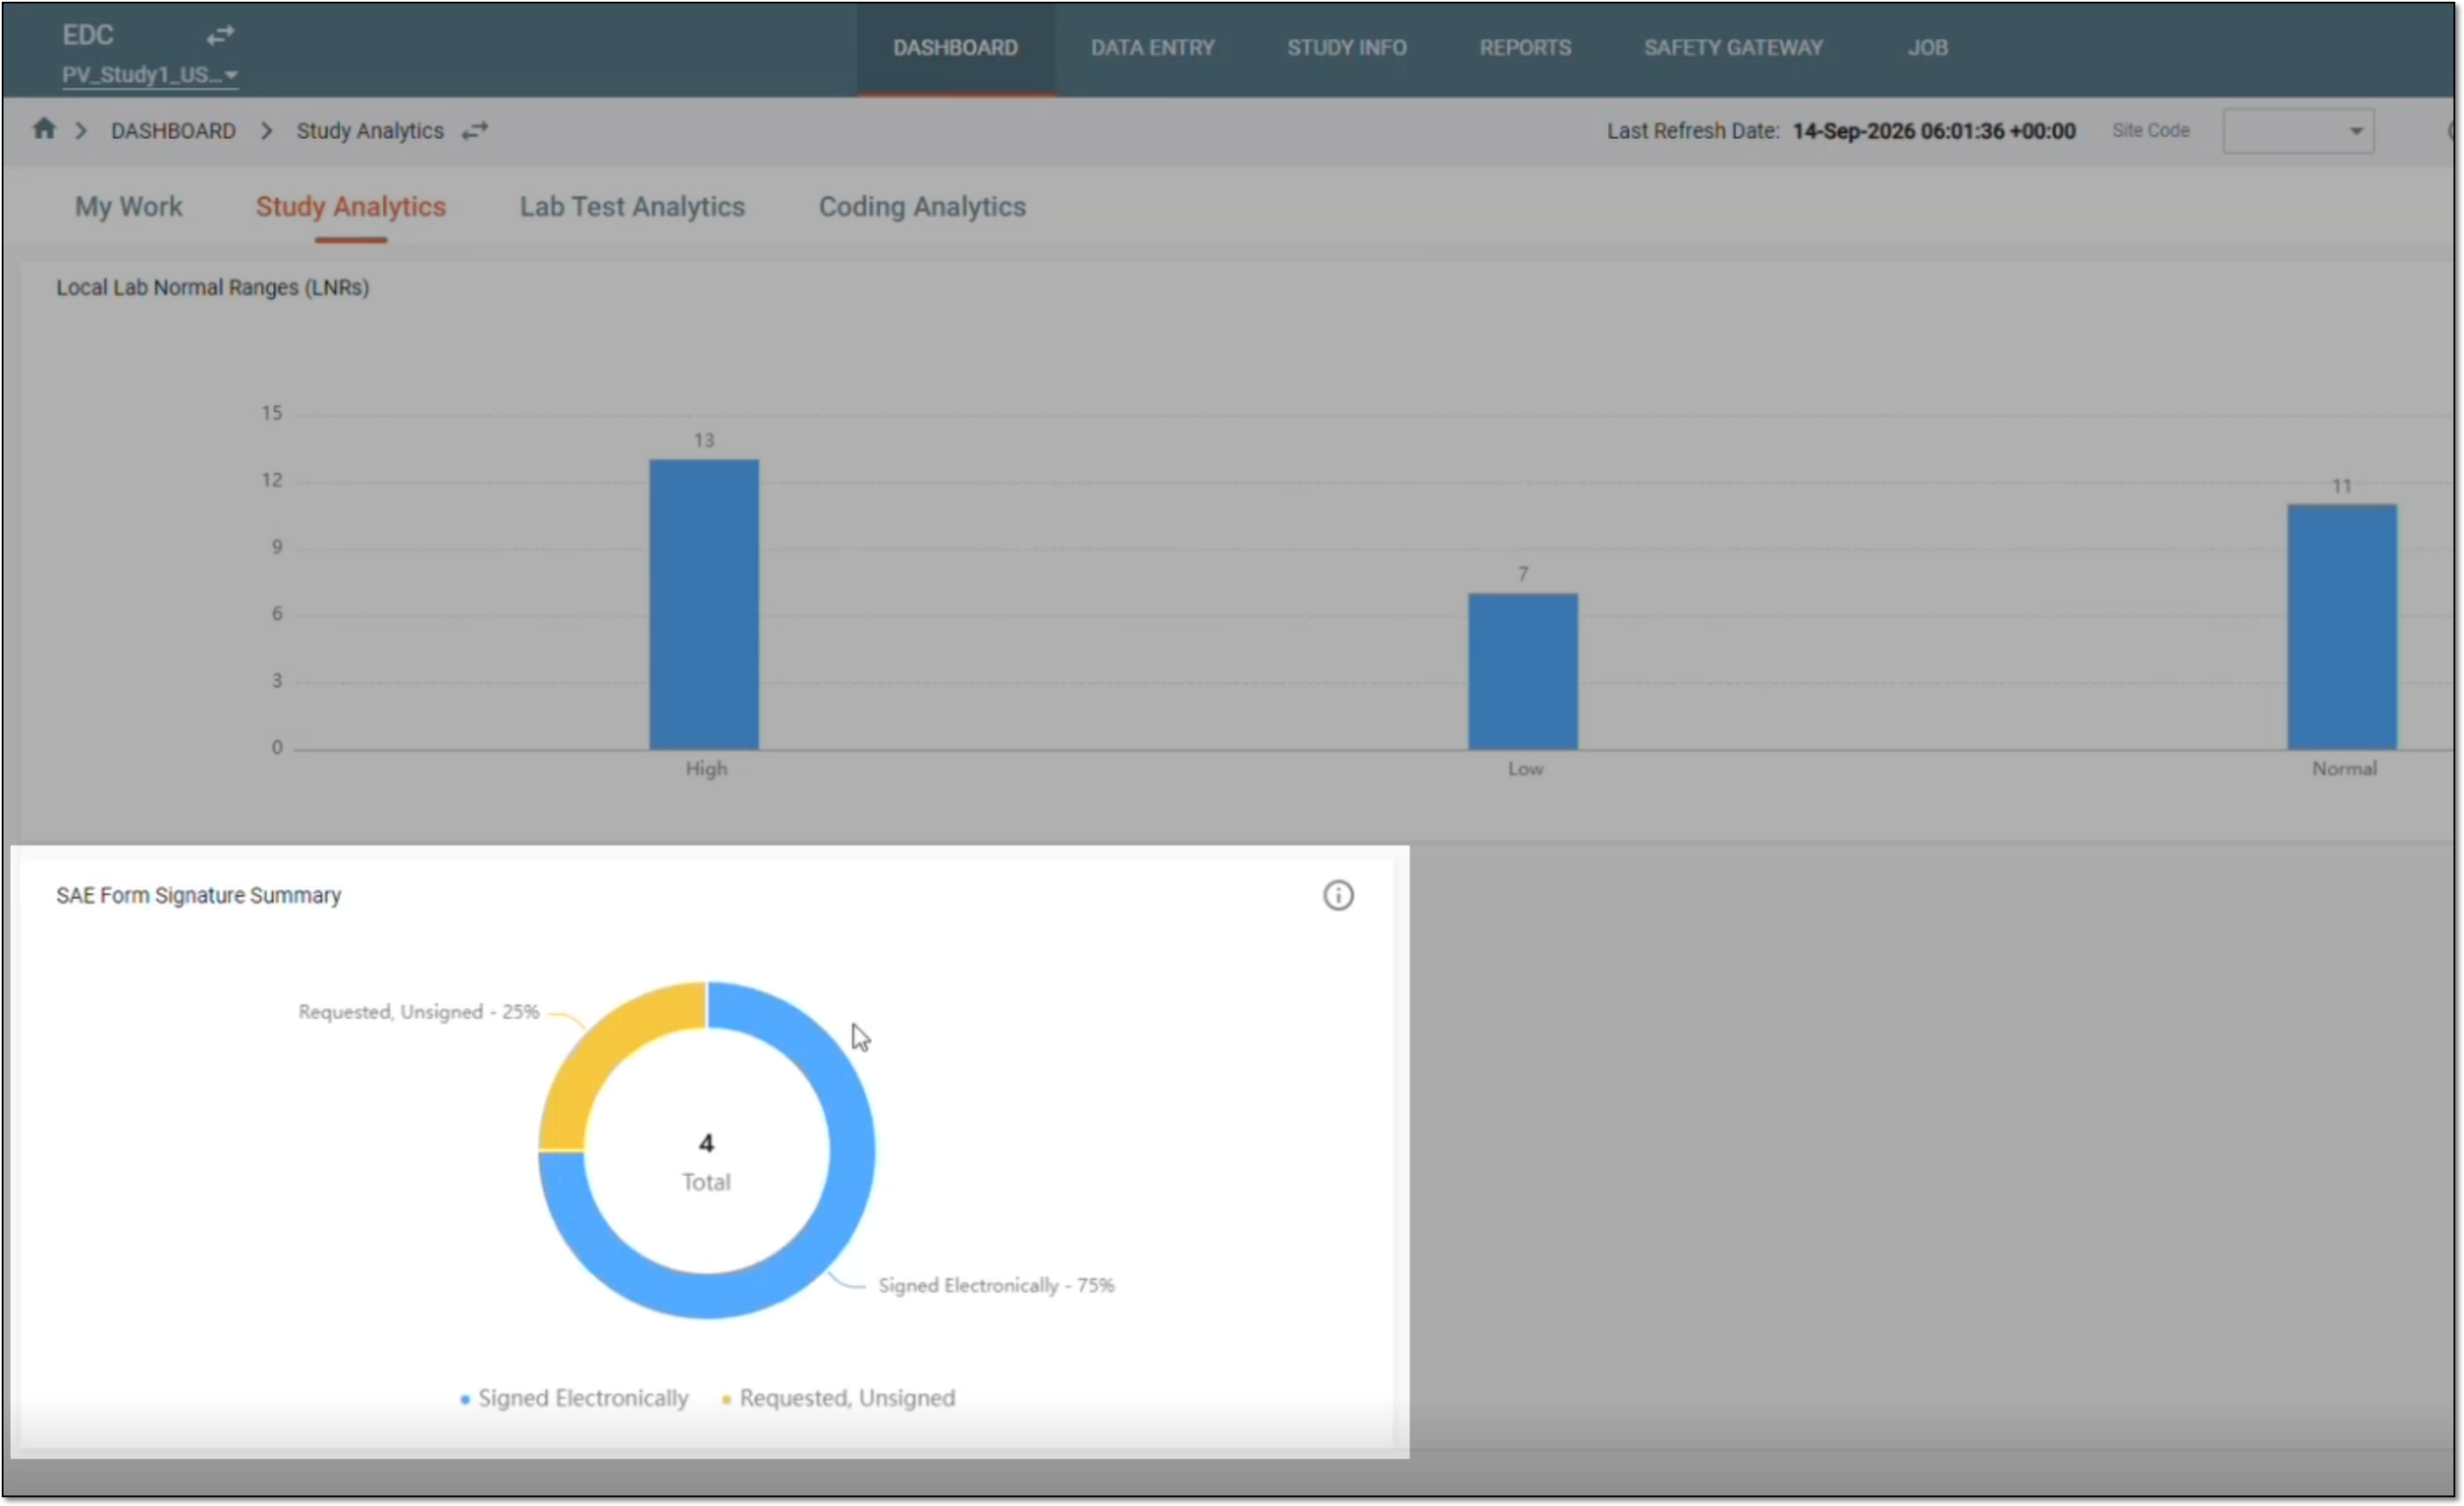
In the Study Analytics dashboard, you are provided with multiple charts to get a quick insight into the EDC data and processes going on. On the SAE Form Signature Summary pie chart, you can view the total number of SAE forms that require signature in EDC as per request from PV. The information in this chart is updated in real-time, that is as soon as a new SAE form signature is requested in PV, the pie chart is updated to display the latest data.
You may require viewing the pie chart if you want to know how many SAE forms await the signature to complete the respective tasks or analyze the efficiency.
Tip
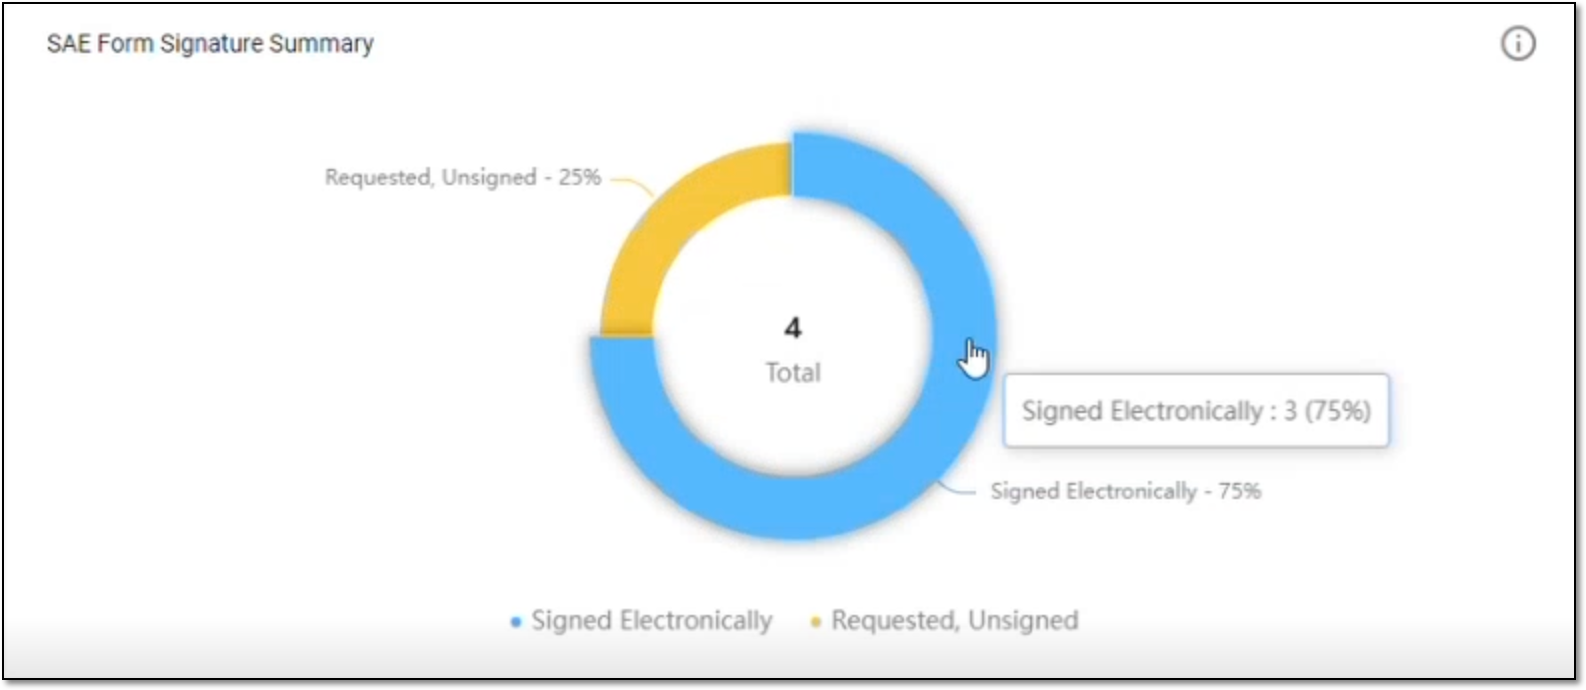
If you want to know the exact number of SAE forms in each of the available statuses, hover over the required color in the pie chart to view the required information. For example, as shown in the following figure, the total number of SAEs signed electronically is three.
 |